My *Expert* Opinion

My *Expert* Opinion

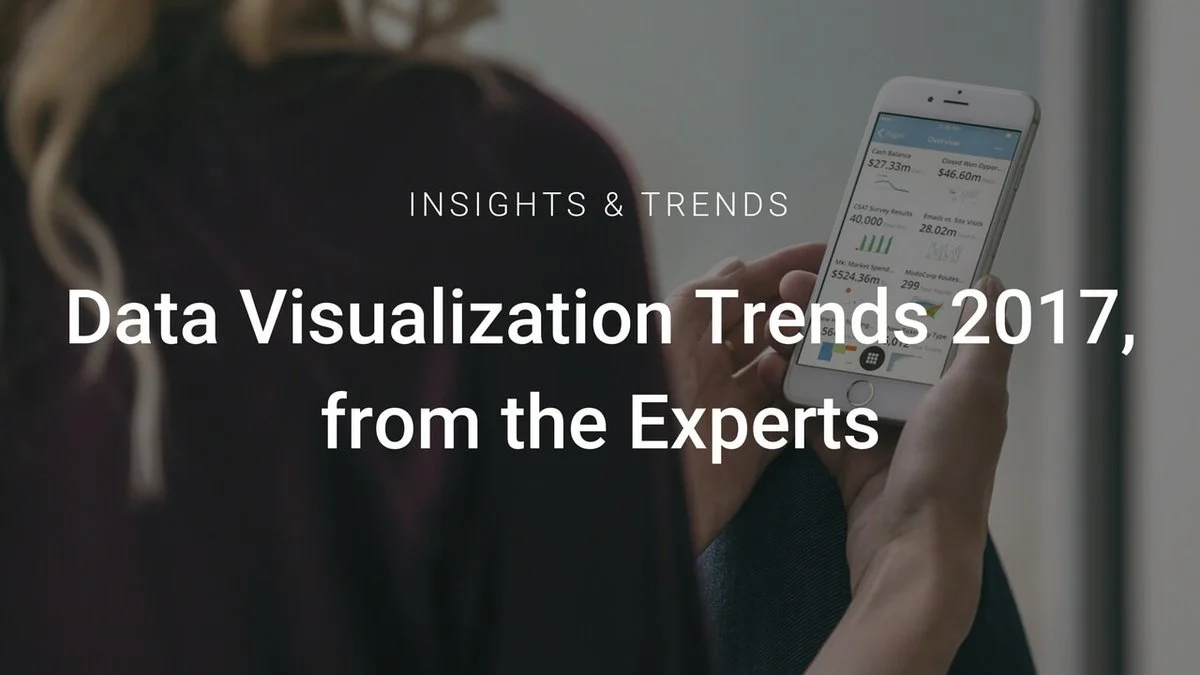
The team at Infogram recently published an article titled Top Data Visualization Trends in 2017, which they sourced from a diverse range people in the industry (including me). I was pretty amused to be called an expert in their promotional tweets, but then realized that I do spend a LOT of time thinking about this stuff, so I'll take it. 

Read More
Tapestry 2017 Recap

Tapestry 2017 Recap

Last week I attended my favorite conference, Tapestry, for data storytelling. This is my third year running, and it's starting to feel like family reunion. Last year, I gave a short story presentation on the power of drawing in visual storytelling, which you can watch on the conference archive page. You can also read a recap of the experience and check out my sketchnotes over on my blog. 

Read More

January Sketchbook Highlights

January Sketchbook Highlights

This is the first of a (hopefully) monthly installation where I share 12 of my favorite pages from my sketchbook that I have created over the past month, presented without comment. I realized that I only share a small fraction of the images that I create, so this is an effort to show you the process behind the curtain, or just other random uses for Paper. 

Read More